Essay
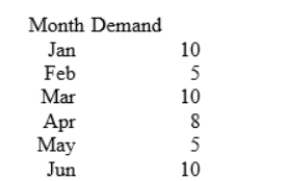
The table below shows the demand for Gadgets (they're like Widgets, only they're more mechanical) over a five-month period. Calculate exponential smoothing forecasts for each month and for July. Use a coefficient of 0.5 and assume that the forecast for January was 8. Also evaluate the quality of the exponential smoothing model by calculating the root-mean-square error for the data set. Note: round all intermediate calculations to two decimal places.
Correct Answer:

Verified
 Forecast for July: (6.63)(0.5...
View Answer
Unlock this answer now
Get Access to more Verified Answers free of charge
Correct Answer:
Verified
View Answer
Unlock this answer now
Get Access to more Verified Answers free of charge
Q7: The use of an estimated demand equation
Q8: The use of leading indicators to forecast
Q9: Forecasts based on leading indicators are qualitative.
Q10: The table below shows semi-annual demand (in
Q11: The ratio-to-trend method is used to estimate
Q13: Macroeconomic forecasts are generally based on multiple-equation
Q14: The Delphi method generates forecasts by surveying
Q15: Definitional equations must be estimated using regression
Q16: Councils of distinguished foreign dignitaries and businesspersons
Q17: The use of a linear trend equation