Multiple Choice
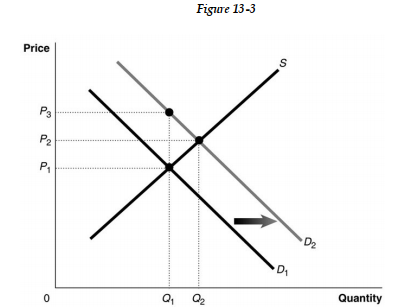 Figure 13-3 shows a market with an externality. The current market equilibrium output of Q1 is not the economically efficient output. The economically efficient output is Q2.
-Refer to Figure 13 -3. If, because of an externality, the economically efficient output is Q2 and not the current equilibrium output of Q1, what does What does D2 represent?
A) the demand curve reflecting external benefits
B) the demand curve reflecting social benefits
C) the demand curve reflecting the sum of social and external benefits
D) the demand curve reflecting private benefits
Correct Answer:

Verified
Correct Answer:
Verified
Q1: How does the construction of a market
Q2: If an externality exists, it will be
Q4: <img src="https://d2lvgg3v3hfg70.cloudfront.net/TB9865/.jpg" alt=" Figure 13-2 shows
Q5: Mona and Salwa share an apartment and
Q6: Issuing marketable emission allowance permits to polluting
Q7: <img src="https://d2lvgg3v3hfg70.cloudfront.net/TB9865/.jpg" alt=" Figure 13-2 shows
Q8: Which of the following statements is false?<br>A)
Q9: <img src="https://d2lvgg3v3hfg70.cloudfront.net/TB9865/.jpg" alt=" Figure 13-4 shows
Q10: What is a market failure?<br>A) It refers
Q11: Which of the following represents the economic