Multiple Choice
The neutron-proton stability curve of the isotopes of all elements will be plotted on a graph whose axes are shown in Figure 29-1.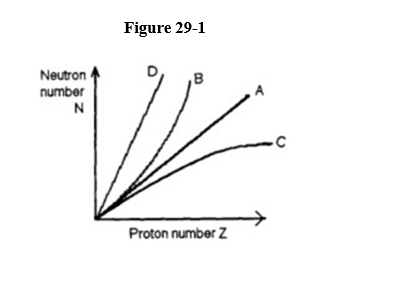
The plot will look like
A) graph A.
B) graph B.
C) graph C.
D) graph D.
Correct Answer:

Verified
Correct Answer:
Verified
Related Questions
Q38: Donald Glazer<br>A) observed back-scattering from nuclei.<br>B) invented
Q39: When a neutron is emitted from an
Q40: When an alpha particle is emitted from
Q41: Which of the following is NOT a
Q42: An atom's mass number is determined by
Q44: The type of detector that uses liquid
Q45: When a nucleus undergoes beta-minus decay, it
Q46: Ernest Rutherford<br>A) observed back-scattering from nuclei.<br>B) proposed
Q47: What happens to the half-life of a
Q48: All isotopes are unstable which have proton