Short Answer
The graph shown in Figure 27-1 is a plot based on student data from their testing of a
photoelectric material.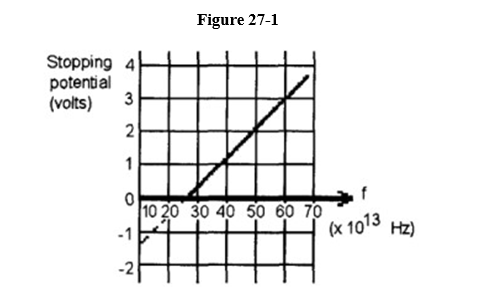
(a) Determine the cutoff frequency.
(b) Determine the work function.
Correct Answer:

Verified
(a) 25. × 1013<...View Answer
Unlock this answer now
Get Access to more Verified Answers free of charge
Correct Answer:
Verified
(a) 25. × 1013<...
View Answer
Unlock this answer now
Get Access to more Verified Answers free of charge
Related Questions
Q19: The energy of a photon depends on<br>A)
Q20: In the photoelectric effect, the energies of
Q21: In the Compton effect, as the scattering
Q22: Give an example of a material whose
Q23: The compact disc stores information by means
Q25: The ratio of energy to frequency for
Q26: When the accelerating voltage in an X-ray
Q27: Bohr's atomic theory predicted energy levels for
Q28: What is the ionization energy for a
Q29: Classical theory predicts that the planets can