Multiple Choice
Which of the graphs in Figure 17-5 indicates that a positive temperature coefficient is obeyed for the entire range shown?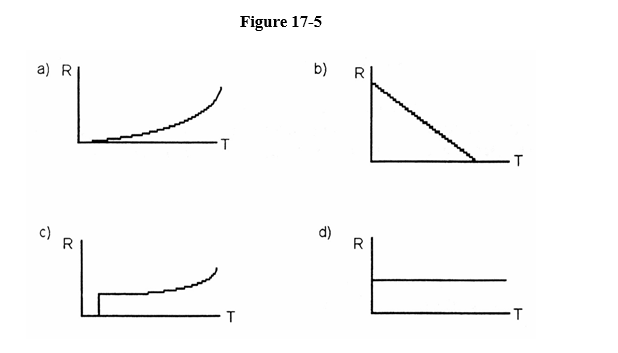
A) graph a
B) graph b
C) graph c
D) graph d
Correct Answer:

Verified
Correct Answer:
Verified
Related Questions
Q3: In the graph shown in Figure 17-7,
Q4: The resistance of an object is defined
Q5: Figure 17-3 is the symbol for a<br><img
Q6: A coffee maker, which draws 13.5 A
Q7: A battery has an internal resistance of
Q9: A home appliance is rated at 250.
Q10: The heating element in an electric drier
Q11: A 120-m long copper wire (resistivity 1.68
Q12: A 200. ? resistor is rated at
Q13: The monthly (30 days) electric bill included