Short Answer
Shown in Figure 13-3 is a graph of position vs. time for a system undergoing simple harmonic motion. Which of the other graphs represents the system's acceleration as a function of time?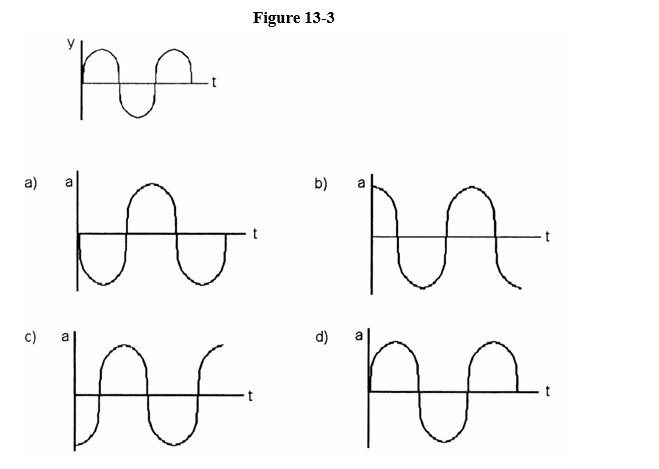
Correct Answer:

Verified
Correct Answer:
Verified
Related Questions
Q59: Simple pendulum A swings back and forth
Q60: Tarzan swings back and forth on a
Q61: A spring-driven dart gun propels a 10.
Q62: What is the wavelength (in meters) of
Q63: Imagine hitting a heavy anvil with a
Q65: Simple Harmonic Motion is characterized by<br>A) acceleration
Q66: The total energy stored in simple harmonic
Q67: A spring has 0.770 kg oscillating on
Q68: The equation of motion of a particle
Q69: A 1.33 kg dense mass is on