Multiple Choice
Shown in Figure 13-2 is a graph of position vs. time for a system undergoing simple harmonic motion. Which of the other graphs represents the system's velocity as a function of time?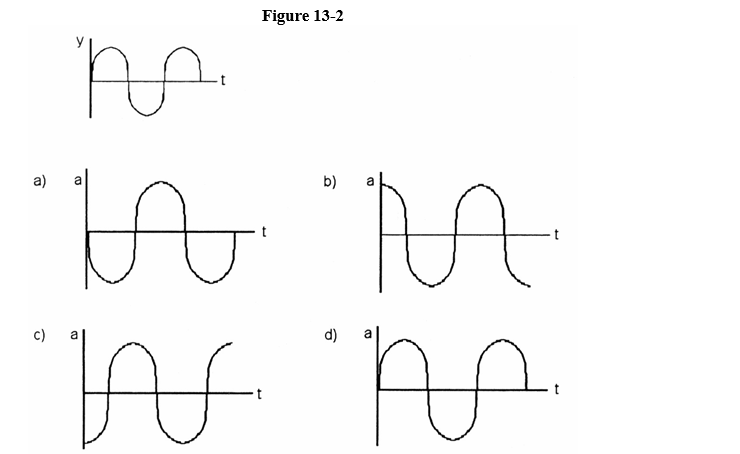
A) graph a
B) graph b
C) graph c
D) graph d
Correct Answer:

Verified
Correct Answer:
Verified
Related Questions
Q29: When a wave obliquely crosses a boundary
Q30: Total constructive interference occurs when two waves
Q31: A 0.30 kg mass is suspended on
Q32: The total distance traveled by an object
Q33: SHM may be written y = A
Q35: Suppose you wish to lower the pitch
Q36: When waves interfere, the result is _
Q37: A string of linear density 1.5 g/m
Q38: A simple pendulum has a length of
Q39: If one doubles the tension in a