Multiple Choice
The process shown on the T-V graph in Figure 12-8 is an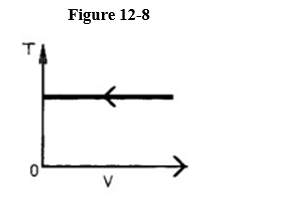
A) isobaric compression.
B) isometric compression.
C) isothermal compression.
D) adiabatic compression.
Correct Answer:

Verified
Correct Answer:
Verified
Related Questions
Q6: A reversible engine takes in 40. Joules
Q7: A heat engine operating between 40° C
Q8: Entropy of the universe is increasing.
Q9: A cyclic process is carried out on
Q10: A certain amount of a monatomic gas
Q12: Is it possible for heat to travel
Q13: An ideal gas is compressed isothermally from
Q14: A coal-fired plant generates 600 MW of
Q15: Coefficient of performance is<br>A) Q<sub>out</sub>/W<sub>in</sub>.<br>B) Q -
Q16: Isobaric work is<br>A) p <span