Multiple Choice
The graph in Figure 2-5 plots the velocity of two cars (A and B) along the same straight road.
Figure 2-5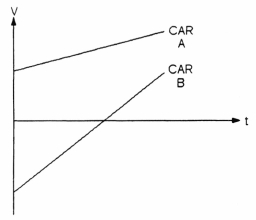
During the time interval shown, which car is AHEAD?
A) Car A
B) Car B
C) insufficient information
Correct Answer:

Verified
Correct Answer:
Verified
Related Questions
Q69: A race car circles 10 times around
Q70: Which of the following can never be
Q71: Barbara travels 20. km Northward, then travels
Q72: Speed is to velocity as distance is
Q73: <img src="https://d2lvgg3v3hfg70.cloudfront.net/TB9720/.jpg" alt=" -Figure 2-15 shows
Q75: A ball is thrown straight up and
Q76: For this problem, assume that the acceleration
Q77: A negative velocity, approaching zero, represents a
Q78: Use the Figure 2-12 below to answer
Q79: Use the Figure 2-14 below to answer