Multiple Choice
Solve the problem.
-Suppose that during a certain step in a chemical manufacturing process the amount of chlorine dissolved in a solution, measured in parts per million (ppm) , is related to the elapsed time measured from the beginning of the step. Use the following table as a representation of this relationship. Make a scatter diagram of the data. What is happening to the amount of chlorine in solution during this time frame?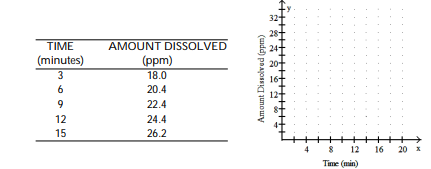
A) 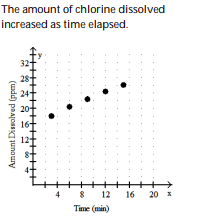
B) 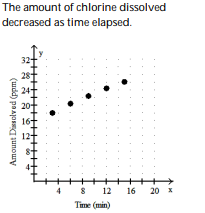
C) 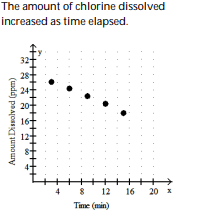
D) 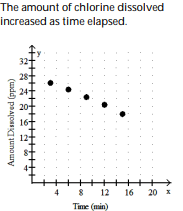
Correct Answer:

Verified
Correct Answer:
Verified
Q229: Find the domain and range of the
Q230: Solve the problem.<br>-The table lists the average
Q231: Determine whether the graphs of the equations
Q232: Decide whether or not the ordered pair
Q233: Solve.<br>-Complete these ordered pairs for the equation
Q235: Determine whether the graphs of the equations
Q236: Plot the ordered pairs on the rectangular
Q237: Complete the ordered pair for the given
Q238: Evaluate the function.<br>-Given f(x) = 2x<sup>2 </sup>-
Q239: Graph the linear equation. Give the x-