Multiple Choice
Solve the problem.
-Suppose that the speed of a car, measured in miles per hour (mph) , is monitored for some short period of time after the driver applies the brakes. The following table relates the speed of the car to the amount of time, measured in seconds (sec) , elapsed from the moment that the brakes are applied. Make a scatter diagram of the data. What is happening to the speed of the car during this time frame? 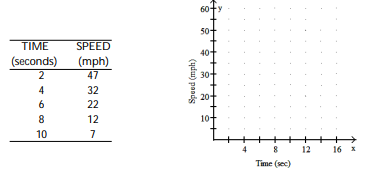
A) 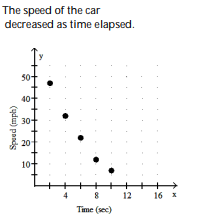
B) 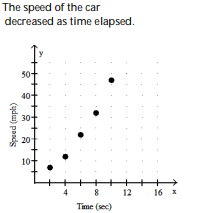
C) 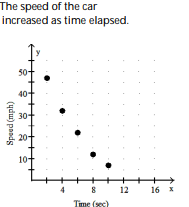
D) 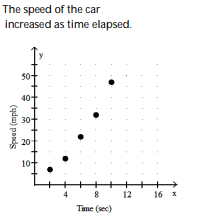
Correct Answer:

Verified
Correct Answer:
Verified
Q67: Answer the question<br>-The graph of the equation
Q68: Write an equation of the line through
Q69: Solve the problem<br>-(4, 0), m = (-1/2)<br><img
Q70: Determine whether the relation is or is
Q71: Identify the slope and y- intercept of
Q73: Complete the table of values for the
Q74: Decide whether or not the ordered pair
Q75: Complete the table of values for the
Q76: Complete the graph by shading the
Q77: Find the intercepts for the graph of