Multiple Choice
Solve the problem.
-Suppose that the speed of a car, measured in miles per hour (mph) , is monitored for some short period of time after the driver applies the brakes. The following table and graph relate the speed of the car to the amount of time, measured in seconds (sec) , elapsed from the moment that the brakes are applied. What is happening to the speed of the car during this time frame? In which of the time intervals does the speed change the most? 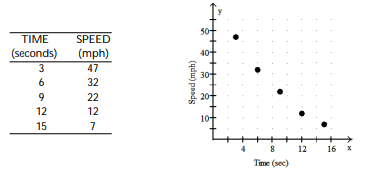
A) With increasing elapsed time, the speed decreases. The speed changes most during the time interval from 12 seconds to 15 seconds.
B) With increasing elapsed time, the speed increases. The speed changes most during the time interval from 3 seconds to 6 seconds.
C) With increasing elapsed time, the speed decreases. The speed changes most during the time interval from 3 seconds to 6 seconds.
D) With increasing elapsed time, the speed increases. The speed changes most during the time interval from 12 seconds to 15 seconds. 
Correct Answer:

Verified
Correct Answer:
Verified
Q327: Graph the linear equation.<br>-y = x +
Q328: Find the slope of the line going
Q329: Complete the ordered pairs. Then graph the
Q330: Decide whether the equation defines y as
Q331: After reading the sentence, correctly fill
Q333: Find the slope of the line.<br>-2y =
Q334: Answer the question<br>-The graph of the equation
Q335: Complete the table of values for the
Q336: Solve the problem<br>-A cable TV company charges
Q337: Evaluate the function.<br>-Given f(x) = - x