Multiple Choice
Solve by graphing. Label the axes and show where the solution is located on the graph.
-In one U.S. town the annual consumption, b, of beef (in kg per person) can be estimated by b = - .33t + 25, where t is the number of years since 1975. Graph the equation and use the graph to estimate the beef consumption in the year 1995.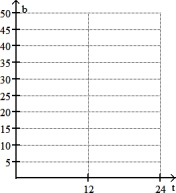
A) About 32 kg per person
B) About 15 kg per person
C) About 18 kg per person
D) About 12 kg per person
Correct Answer:

Verified
Correct Answer:
Verified
Q114: Choose the line that most closely resembles
Q115: Evaluate the function.<br>-Given f(x) = x<sup>2 </sup>-
Q116: Complete the ordered pairs. Then graph the
Q117: Decide whether the equation defines y as
Q118: Graph the linear equation.<br>-y - 4 =
Q120: Complete the ordered pairs. Then graph the
Q121: Write the slope-intercept form of the equation
Q122: Write an equation for the line passing
Q123: Graph the linear equation.<br>-2x - y =
Q124: Find the slope of the line going