Multiple Choice
Solve by graphing. Label the axes and show where the solution is located on the graph.
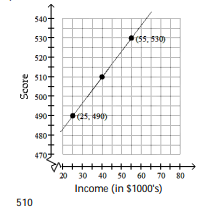
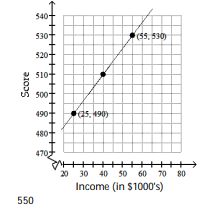
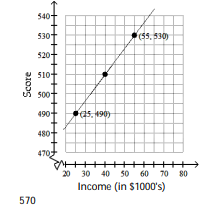
-The graph depicts a relationship between scores achieved on an unspecified standardized test and family income. Suppose the score for a test is 490 when the family income is $25,000 and is 530 when the family income is $55,000. Let x be the income and y be the score of the test. Graph the two given pairs of incomes and scores. Assume that the relationship is linear. Draw a line though the two previous points. From your graph, estimates the score if the family income is $40,000.
A) 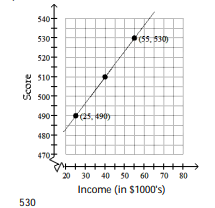
B)
C)
D)
Correct Answer:

Verified
Correct Answer:
Verified
Q57: State whether the graph is or is
Q58: Choose the line that most closely resembles
Q59: Decide whether or not the ordered pair
Q60: Solve the problem.<br>-In order to make a
Q61: Provide the proper response.<br>-Give a definition of
Q63: Determine whether the relation is or is
Q64: Solve.<br>-How do you find the x- intercept
Q65: Decide whether the equation defines y as
Q66: Graph the linear equation. Give the x-
Q67: Answer the question<br>-The graph of the equation