Multiple Choice
Solve the problem.
-Data regarding the amount spent by a government department is represented in the following graph. Find the change in amount spent for the years shown in the graph. Is the graph a straight line?
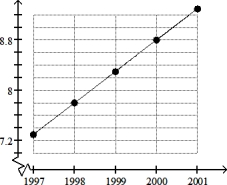
Year
A) Change for each year: $0.13 billion; yes
B) Change for each year: $0.33 billion; yes
C) Change from 1998 to 1999: $0.52 billion, change from 1999 to 2000: $0.13 billion; no
D) Change for each year: $0.52 billion; yes
Correct Answer:

Verified
Correct Answer:
Verified
Q123: Graph the linear equation.<br>-2x - y =
Q124: Find the slope of the line going
Q125: Give the ordered pairs for the points
Q126: Solve the problem<br>-(-2, -1), m = 2<br><img
Q127: Solve the problem.<br>-A hardware store has room
Q129: Provide an appropriate response.<br> <br>-What were the
Q130: Solve the problem.<br>-The table lists the average
Q131: Find an equation in slope-intercept form of
Q132: Decide whether the equation defines y as
Q133: Evaluate the function.<br>-Given f(x) = (x -