Multiple Choice
Solve the problem.
-This chart shows the number of meals served in a restaurant during each of the past 4 months. Assume that the information in the chart defines a function with the name g. State the domain of g.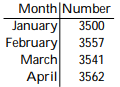
A) 
B) 
C) 
D) 
Correct Answer:

Verified
Correct Answer:
Verified
Related Questions
Q23: Find the intercepts for the graph of
Q24: Write an equation for the line. Give
Q25: Answer the question or write an explanation.<br>-Is
Q26: Plot the ordered pairs on the rectangular
Q27: Find the intercepts for the graph of
Q29: Solve by graphing. Label the axes and
Q30: Complete the graph by shading the correct
Q31: Provide an appropriate response.<br> <br>-What were the
Q32: Find the slope of the line going
Q33: For the given equation, complete the table