Multiple Choice
Solve the problem.
-This chart shows the number of meals served in a restaurant during each of the past 4 months. Assume that the information in the chart defines a function with the name g. Find g(March) .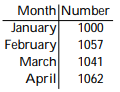
A) 1000
B) 1057
C) 1062
D) 1041
Correct Answer:

Verified
Correct Answer:
Verified
Related Questions
Q304: Decide whether or not the ordered pair
Q305: Graph the linear inequality<br>--2x - 3y
Q306: Decide whether or not the ordered pair
Q307: Graph the line through the given point
Q308: Write the slope-intercept form of the equation
Q310: Complete the graph by shading the
Q311: Complete the graph by shading the
Q312: Solve by graphing. Label the axes and
Q313: Determine whether the graphs of the equations
Q314: Graph the linear equation. Give the x-