Multiple Choice
Solve the problem.
-This chart shows the number of meals served in a restaurant during each of the past 4 months. Assume that the information in the chart defines a function with the name g. For which x does g(x) = 4062?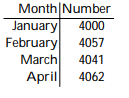
A) April
B) February
C) March
D) January
Correct Answer:

Verified
Correct Answer:
Verified
Q167: Solve the problem<br>-An electrician charges a fee
Q168: Write the slope-intercept form of the equation
Q169: Use the geometric interpretation of slope (rise
Q170: Complete the ordered pair for the given
Q171: Describe the graph of the function
Q173: Provide the proper response.<br>-If two nonvertical lines
Q174: Solve the problem.<br>-The table lists the average
Q175: Graph the linear equation. Give the x-
Q176: Plot the ordered pairs on the rectangular
Q177: Give the ordered pairs for the points