Multiple Choice
The table shown was generated by a graphics calculator. The expression y1 represents f(x) .
-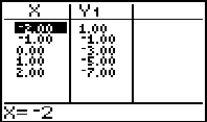
All the points lie on a straight line. What is the slope of the line?
A) - 2
B) -1/2
C) 2
D) -3
Correct Answer:

Verified
Correct Answer:
Verified
Related Questions
Q98: Complete the ordered pair for the given
Q99: How does one decide whether a set
Q100: After reading the sentence, correctly fill
Q101: Solve by graphing. Label the axes and
Q102: Provide the proper response.<br>-If two nonvertical lines
Q104: Solve the problem<br>-(0, 6), m = (-1/5)<br><img
Q105: Answer the question or write an explanation.<br>-What
Q106: Decide whether the relation represents a function.
Q107: Provide the proper response.<br>-What is wrong with
Q108: Use the coordinates of the indicated points