Multiple Choice
The table shown was generated by a graphics calculator. The expression y1 represents f(x) .
-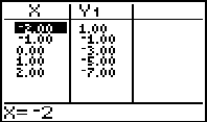
All these points lie on a straight line. Find the y-intercept of the line.
A) - 3
B) -1/3
C) 0
D) Is not shown
Correct Answer:

Verified
Correct Answer:
Verified
Q33: For the given equation, complete the table
Q34: Find an equation in slope-intercept form of
Q35: Write an equation of the line through
Q36: Write the slope-intercept form of the equation
Q37: Find the domain and range of the
Q39: Solve the problem.<br>-<img src="https://d2lvgg3v3hfg70.cloudfront.net/TB9570/.jpg" alt="Solve the problem.
Q40: Graph the linear inequality<br>-<img src="https://d2lvgg3v3hfg70.cloudfront.net/TB9570/.jpg" alt="
Q41: Find the domain and range of the
Q42: Solve the problem<br>-A moving firm charges a
Q43: Solve by graphing. Label the axes and