Multiple Choice
The table shown was generated by a graphics calculator. The expression y1 represents f(x) .
-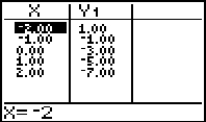
Write the function in the form y = mx + b.
A) y = 2x + 3
B) y = 2x - 3
C) y = - 2x + 3
D) y = - 2x - 3
Correct Answer:

Verified
Correct Answer:
Verified
Related Questions
Q132: Decide whether the equation defines y as
Q133: Evaluate the function.<br>-Given f(x) = (x -
Q134: Determine whether the relation is or is
Q135: Graph the linear equation.<br>-4x - y =
Q136: Graph the line through the given point
Q138: The equation y = x<sup>2</sup><sup> </sup>is satisfied
Q139: Graph the line through the given point
Q140: Use the coordinates of the indicated points
Q141: Complete the graph by shading the
Q142: Determine whether the graphs of the equations