menu-iconExamlexExamLexServices

Discover

Ask a Question
  1. All Topics
  2. Topic
    Mathematics
  3. Study Set
    Beginning Algebra
  4. Exam
    Exam 4: Systems of Linear Equations and Inequalities
  5. Question
    The Table Shown Was Generated by a Graphics Calculator
Solved

The Table Shown Was Generated by a Graphics Calculator

Question 53

Question 53

Multiple Choice

The table shown was generated by a graphics calculator. The expression y1 represents f(x) .
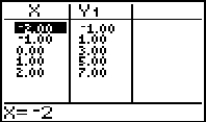
-The table shown was generated by a graphics calculator. The expression y<sub>1 </sub>represents f(x) . -  What is f(2) ? A)  2 B)  7 C)  0 D)  Not shown What is f(2) ?


A) 2
B) 7
C) 0
D) Not shown

Correct Answer:

verifed

Verified

Unlock this answer now
Get Access to more Verified Answers free of charge

Related Questions

Q48: State whether the graph is or is

Q49: Graph the linear inequality<br>-5x - y

Q50: Complete the graph by shading the

Q51: Choose the inequality that best matches

Q52: Graph the linear inequality<br>-x - y >

Q54: Graph the linear inequality<br>-3x + y

Q55: Complete the ordered pair for the given

Q56: Graph the linear inequality<br>-2x + 5y

Q57: State whether the graph is or is

Q58: Choose the line that most closely resembles

Examlex

ExamLex

About UsContact UsPerks CenterHomeschoolingTest Prep

Work With Us

Campus RepresentativeInfluencers

Links

FaqPricingChrome Extension

Download The App

Get App StoreGet Google Play

Policies

Privacy PolicyTerms of ServiceHonor CodeCommunity Guidelines

Scan To Download

qr-code

Copyright © (2025) ExamLex LLC.

Privacy PolicyTerms Of ServiceHonor CodeCommunity Guidelines