Essay
The following table shows the demand and supply of labor in the steel manufacturing industry.
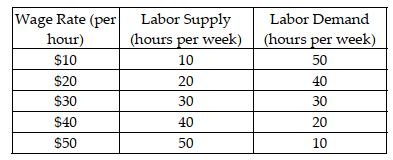 a) What is the equilibrium wage rate and employment level in the industry? Illustrate graphically.
b) If the labor demand shifts to the right, without any change in the labor supply curve, what is likely to happen to the equilibrium wage and the employment level? Explain your answer with the help of a suitable diagram.
c) If the labor supply curve shifts to the left, without any change in the labor demand curve, what is likely to happen to the equilibrium wage and employment level? Explain your answer with the help of a suitable diagram.
Correct Answer:

Verified
a) The equilibrium wage rate is the wage...View Answer
Unlock this answer now
Get Access to more Verified Answers free of charge
Correct Answer:
Verified
View Answer
Unlock this answer now
Get Access to more Verified Answers free of charge
Q1: Victoria Corp. makes running shoes by employing
Q2: In Major League Baseball, a player's WAR
Q3: The table below lists salary and ?productivity?
Q5: Bookland is a country that produces only
Q6: Which of the following correctly identifies a
Q7: In 1986, Roger Clemens pitched 254 innings
Q8: An economy produces only cell phones. In
Q9: In an economy, if the money supply
Q10: An economy produces only cell phones. In
Q11: An economy produces only cell phones. In