Multiple Choice
The following figure shows the cost curves on a firm that operates in a competitive market. Assume that all the firms in this market have identical cost structure.
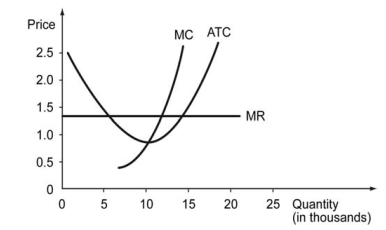
-Refer to the graph above. Which of the following graphs, correctly represents this competitive marke's demand and supply in the long run?
A) 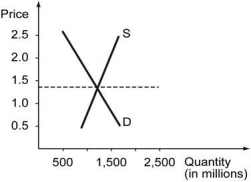
B) 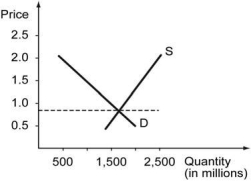
C) 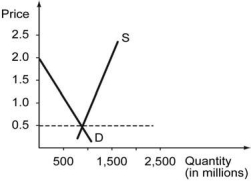
D) 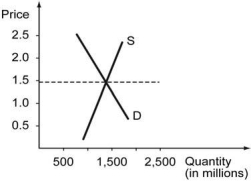
Correct Answer:

Verified
Correct Answer:
Verified
Q4: Berylia?s aggregate production function is Y =
Q5: If the aggregate income of an island
Q6: The following table shows economic data for
Q7: If the income per capita in United
Q8: Suppose the market for AR-15 style rifles
Q10: Two countries, Baltonia and Polonia, have aggregate
Q11: The income per capita in a country
Q12: Two economies, A and B, have identical
Q13: A car repair shop hires workers and
Q14: The price of a standard basket of