Multiple Choice
The diagram below shows the demand curve, supply curve, and the marginal social cost curve for a manufacturing unit.
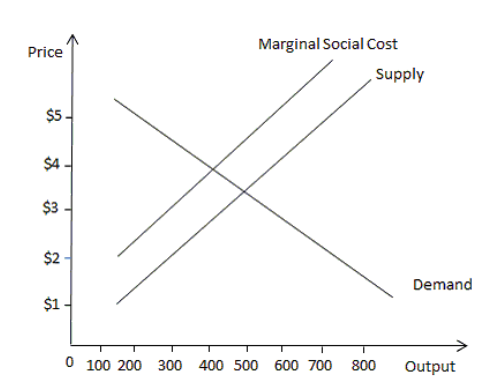
-Refer to the scenario above. In order to ensure that the manufacturing unit produces the socially optimal level of output, the government should________.
A) impose a per unit tax of $1
B) impose a per unit tax of $2
C) provide a subsidy of $1 per unit
D) provide a subsidy of $2 per unit
Correct Answer:

Verified
Correct Answer:
Verified
Q28: A tax used to internalize the social
Q29: According to hedonic analysis, a person's willingness
Q30: Three students share an apartment. They are
Q31: The figure below shows the marginal pollution
Q32: What were the findings of the study
Q34: The production of a good generates a
Q35: The tool that is used for the
Q36: Which of the following is likely to
Q37: Environmental disaster in Easter Island is an
Q38: Briefly explain one potential problem with Pigouvian