Multiple Choice
The figure below shows the marginal pollution abatement cost curves of two firms- Company X and Company Y.
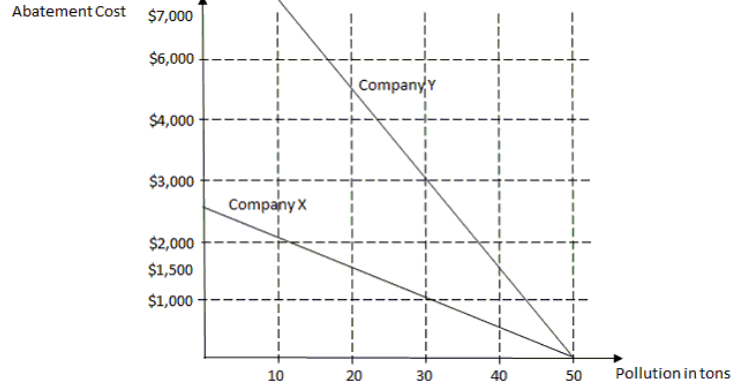
-Refer to the figure above. The marginal cost of reducing 20 tons of emission for Company Y is ________.
A) $1,000
B) $2,000
C) $2,500
D) $3,000
Correct Answer:

Verified
Correct Answer:
Verified
Related Questions
Q1: Which of the following is an example
Q2: One justification for government involvement in research
Q3: Thomas is a construction worker who earns
Q4: According to the concept of hedonic analysis,
Q5: A factory worker earned $1,500 per month.
Q7: The diagram below shows the demand curve,
Q8: The figure below shows the demand, supply
Q9: The diagram below shows the demand curve,
Q10: James received two job offers. Both the
Q11: A worker is willing to accept a