Multiple Choice
The figure below shows the marginal pollution abatement cost curves of two firms- Company X and Company Y.
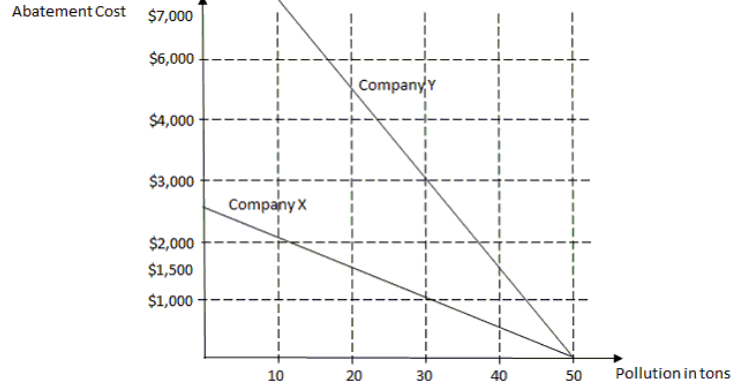
-Refer to the figure above. Assume that firms are allowed to buy and sell permits. If the government allocates 30 pollution permits to each company and the price of each permit is $1,500, Company Y will reduce its emission to ________.
A) 10 tons
B) 20 tons
C) 30 tons
D) 40 tons
Correct Answer:

Verified
Correct Answer:
Verified
Q7: The diagram below shows the demand curve,
Q8: The figure below shows the demand, supply
Q9: The diagram below shows the demand curve,
Q10: James received two job offers. Both the
Q11: A worker is willing to accept a
Q13: What was the effect of the Clean
Q14: What is the importance of technology in
Q15: What are the usual tools used by
Q16: If a worker decides to work at
Q17: The figure below shows the marginal pollution