Multiple Choice
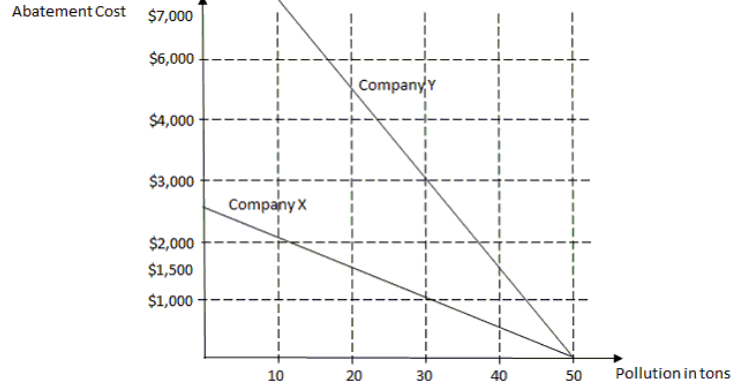
The figure below shows the marginal pollution abatement cost curves of two firms- Company X and Company Y.

-Refer to the figure above. Suppose the government allocates 30 pollution permits to each company and the price of each permit is $1,500. Company ________will earn ________. by selling permits
A) X; $1,000
B) X; $15,000
C) Y; $10,000
D) Y; $1,500
Correct Answer:

Verified
Correct Answer:
Verified
Q45: Pat currently earns $4,250 per month. He
Q46: The figure below shows the marginal pollution
Q47: The production of a good generates a
Q48: Which type of health expenditure can significantly
Q49: John is willing to work at a
Q51: What was the main finding of Bleakley?s
Q52: The figure below shows the marginal pollution
Q53: The figure below shows the marginal pollution
Q54: The figure below shows the marginal pollution
Q55: Which of the following statement is true?<br>A)