Multiple Choice
The figure below shows the marginal pollution abatement cost curves of two firms- Company X and Company Y.
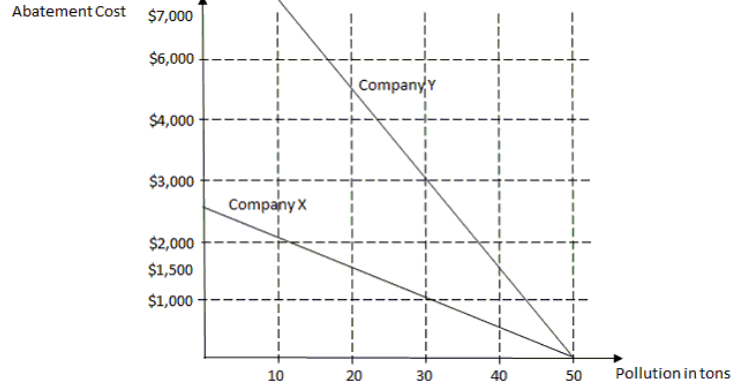
-Refer to the scenario above. Suppose the government allocates 30 pollution permits to each company and the price of each permit is $1,500. Company ________ will spend ________on buying permits.
A) X; $1,000
B) X; $1,500
C) Y; $10,000
D) Y; $15,000
Correct Answer:

Verified
Correct Answer:
Verified
Q14: What is the importance of technology in
Q15: What are the usual tools used by
Q16: If a worker decides to work at
Q17: The figure below shows the marginal pollution
Q18: The figure below shows the marginal pollution
Q20: Thomas is a construction worker who earns
Q21: Does government funding for medical innovations have
Q22: Suppose each firm in an industry is
Q23: In which of the following cases will
Q24: The figure below shows the marginal pollution