Multiple Choice
Use the graph below, which shows changes during the menstrual cycle, to answer the following Questions
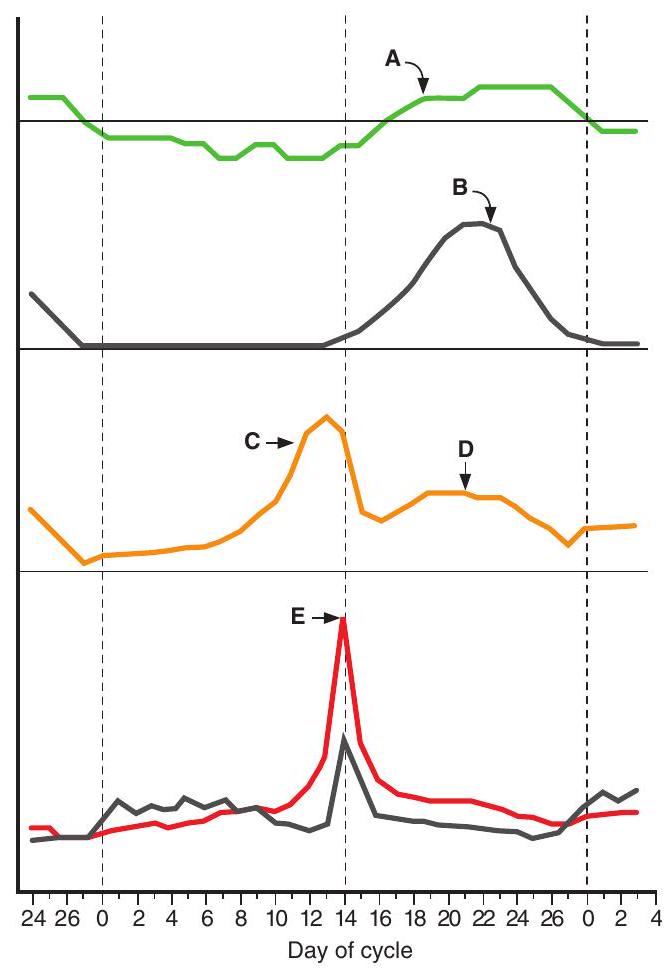
-The source of the increase in concentration indicated at point is the
A) hypothalamus
B) anterior pituitary
C) corpus luteum
D) ovary
E) adrenal cortex
Correct Answer:

Verified
Correct Answer:
Verified
Related Questions
Q7: Which step in steroid hormone biosynthesis
Q8: Which step in steroid hormone biosynthesis
Q9: Which of the following hormones acts
Q10: The source of estrogen during the second
Q11: A 61-year-old woman with hyperthyroidism is
Q13: Which of the following functions of the
Q14: A 39-year-old man with untreated diabetes
Q15: Which of the following results from
Q16: Which step in steroid hormone biosynthesis,
Q17: Which of the following causes increased aldosterone