Multiple Choice
The following figure plots Short Run Average Cost functions for small,medium,and large plants. Based on the figure and plots provided,for which quantity level is a medium plant the best choice? 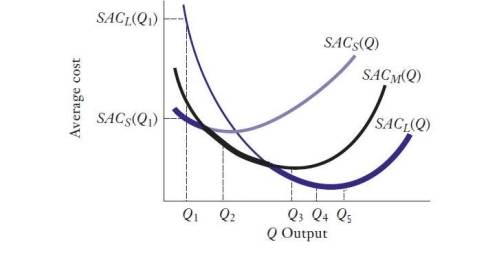
A) Q₁
B) Q₂
C) Q₃
D) Q₄
E) Q₅
Correct Answer:

Verified
Correct Answer:
Verified
Q1: If TC(Q)=1000Q²+100Q+10,what is the formula for AC(Q)?<br>A)2000Q+100<br>B)2000Q²+100Q<br>C)1000Q²+100Q+10<br>D)1000Q+100+10/Q<br>E)100Q+10+1/Q
Q7: What is a Nash equilibrium?<br>A)A state where
Q8: If a firm is producing as efficiently
Q9: In the following sequential decision tree,Alpha chooses
Q12: If η=.8 and P=$25,what is MR?<br>A)$20<br>B)$6.25<br>C)-$5<br>D)-$6.25<br>E)$5
Q24: Suppose a firm's plant produces Q units
Q25: In what special situation might the law
Q27: Suppose a firm's plant produces Q units
Q28: The basic law of demand says that
Q34: Which of the following cost line items