Essay
The table gives the high school dropout rate (as a percent of enrollment) in the United States for the years 2002 to 2008. (Source: United States Census Bureau, 2008)
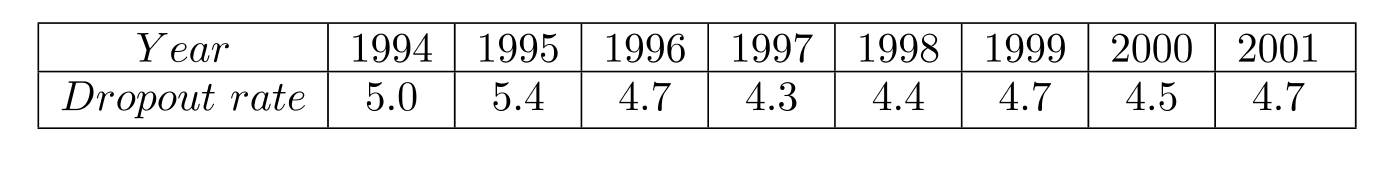
(a) Plot the data letting represent 2002, represent 2003, and so on.
(b) Find a function of the form that models this data. Let represent the vertex, and use (7,3.3) to determine the value of .
(c) Use the statistical capability of a graphing calculator to find the best-fitting quadratic function, , for this data. Graph both functions and from part (b) in the same window as the data points. Which function is the better fit?
Correct Answer:

Verified
Correct Answer:
Verified
Q18: Perform the following for the function
Q19: (a) Solve the quadratic equation
Q20: (a) Given that <span class="ql-formula"
Q21: Perform the following for the function
Q22: Perform the following for the function
Q24: Perform the following for the function
Q25: (a) Solve the quadratic equation
Q26: (a) Use only a graphical method
Q27: (a) Use only a graphical method
Q28: For the quadratic function <span