Essay
The table gives the average price (in dollars) for a gallon of regular unleaded gasoline as measured in September of the years 2003 to 2009. (Source: The Bureau of Labor Statistics, 2009)
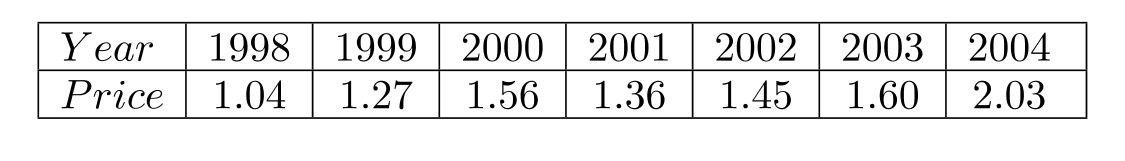
(a) Plot the data letting represent 2003, represent 2004, and so on.
(b) Find a function of the form that models this data. Let represent the vertex, and use to determine the value of .
(c) Use the statistical capability of a graphing calculator to find the best-fitting quadratic function, , for this data. Graph both functions and from part (b) in the same window as the data points. Which function is the better fit?
Correct Answer:

Verified
Correct Answer:
Verified
Q1: Perform each operation with complex numbers.
Q2: Perform the following for the function
Q3: (a) Use only a graphical method
Q4: Divide.<br>(a) <span class="ql-formula" data-value="\frac{x^{3}+2 x+3}{x-2}"><span
Q6: The table gives the number of
Q7: Perform the following for the function
Q8: Perform the following for the function
Q9: For the quadratic function <span
Q10: For the quadratic function <span
Q11: Divide.<br>(a) <span class="ql-formula" data-value="\frac{x^{3}-3 x^{2}+2}{x-1}"><span