Essay
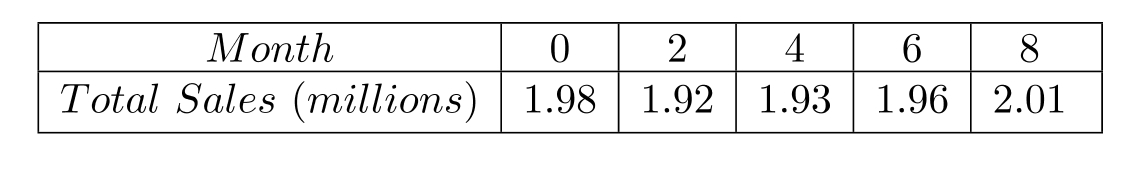
During one period, the average price of a gallon of gasoline in a town changed from day to day. The table shows the average price, in dollars, for each of several consecutive days, where 0 represents Sunday, 1 represents Monday, and so on. Use the data points , and to find a quadratic function defined by that models the data. Graph together with the data.
Correct Answer:

Verified
Correct Answer:
Verified
Q17: Perform the following matrix operations if
Q18: Consider the system of equations<br> <span
Q19: Solve the system by using Cramer's
Q20: Suppose that <span class="ql-formula" data-value="A"><span
Q21: Find the partial fraction decomposition for
Q23: Perform the following matrix operations if
Q24: Evaluate each determinant.<br>(a) <span class="ql-formula"
Q25: Consider the system of equations<br> <span
Q26: The solution set of a system
Q27: Consider the system of equations<br> <span