Multiple Choice
Use the following to answer the questions below:
Students in a small statistics course wanted to investigate if forearm length (in cm) was useful for predicting foot length (in cm) . The data they collected are displayed in the provided scatterplot (with regression) , and the computer output from the analysis is provided.
Use three decimal places when reporting the results from any calculations, unless otherwise specified.
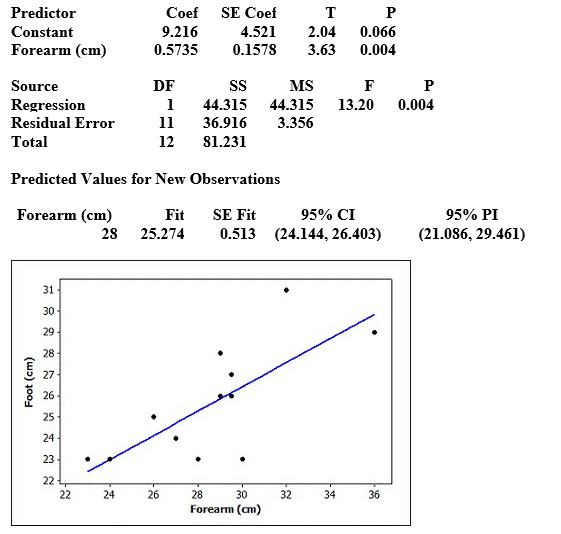
The regression equation is Foot (cm) = 9.22 + 0.574 Forearm (cm)
-Use the ANOVA table to compute and interpret 
.
A) 0.546
About 55% of the variability in foot lengths in this sample is explained by the person's forearm length.
B) 0.298
About 30% of the variability in foot lengths in this sample is explained by the person's forearm length.
C) 0.454
About 45% of the variability in foot lengths in this sample is explained by the person's forearm length.
D) 0.206
About 21% of the variability in foot lengths in this sample is explained by the person's forearm length.
Correct Answer:

Verified
Correct Answer:
Verified
Q75: Use the following to answer the questions
Q76: Use the following to answer the questions
Q77: Use the following to answer the questions
Q78: Use the following to answer the questions
Q79: Use the following to answer the questions
Q81: Use the following to answer the questions
Q82: Use the following to answer the questions
Q83: Use the following to answer the questions
Q84: Use the following to answer the questions
Q85: Construct and interpret a 95% interval for