Multiple Choice
Use the following to answer the questions below:
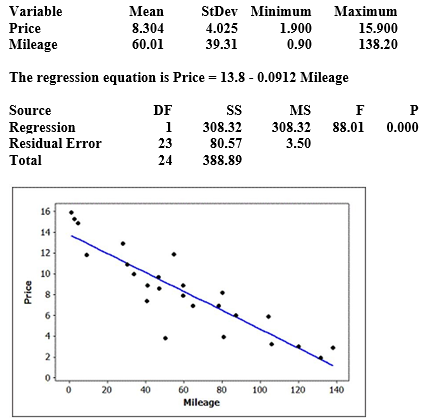
Data were collected on the mileage (in thousands of miles) and price (in thousands of dollars) of a random sample of used Hyundai Elantras. A scatterplot of the data (with regression line) , some summary statistics, and partial computer output from a regression analysis are provided.
Use three decimal places when reporting the results from any calculations, unless otherwise specified.
-Use the following computer output to identify and interpret a 95% interval for the mean price of all used Hyundai Elantras with 30,000 miles.
Predicted Values for New Observations

A) We are 95% sure that the mean price of all used Hyundai Elantras with 30,000 miles is between $10,058 and $12,022.
B) We are 95% sure that the price of a single used Hyundai Elantra with 30,000 miles is between $7046 and $15,034.
C) We are 95% sure that the price of a single used Hyundai Elantras with 30,000 miles is between $10,058 and $12,022.
D) We are 95% sure that the mean price of all used Hyundai Elantras with 30,000 miles is between $7046 and $15,034.
Correct Answer:

Verified
Correct Answer:
Verified
Q67: Use the following to answer the questions
Q68: Use the following to answer the questions
Q69: Use the following to answer the questions
Q70: Use the following to answer the questions
Q71: Use the following to answer the questions
Q73: Use the following to answer the questions
Q74: Is the linear model effective at predicting
Q75: Use the following to answer the questions
Q76: Use the following to answer the questions
Q77: Use the following to answer the questions