Multiple Choice
Use the following to answer the questions below:
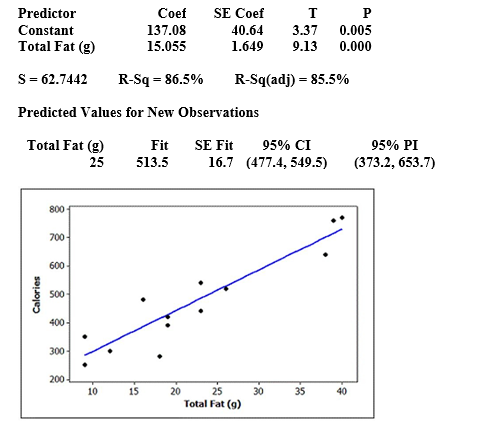
Fast food restaurants are required to publish nutrition information about the foods they serve. Nutrition information about a random sample of 15 McDonald's lunch/dinner menu items (excluding sides and drinks) was obtained from their website. We wish to use the total fat content (in grams) to better understand the number of calories in the lunch/dinner menu items at McDonald's. Computer output from a regression analysis and a scatterplot (with regression line) of the data are provided.
Use two decimal places when reporting the results from any calculations, unless otherwise specified.
The regression equation is Calories = 137.1 + 15.06 Total Fat (g)
-What is the  for this model? Interpret it in context.
A)  = 86.5%
86) 5% of the variability in the number of calories for lunch/dinner menu items in this sample is explained by the total fat content (g) .
B)  = 86.5%
86) 5% of the variability in the the total fat content in this sample is explained by the number of calories.
C)  = 85.5% 85.5% of the variability in the number of calories for lunch/dinner menu items in this sample is explained by the total fat content (g) .
D)  = 85.5% 85.5% of the variability in the the total fat content in this sample is explained by the number of calories.
Correct Answer:

Verified
Correct Answer:
Verified
Q4: Use the following to answer the questions
Q5: Use the following to answer the questions
Q6: Use the following to answer the questions
Q7: Use the following output to identify and
Q8: Use the following to answer the questions
Q10: Use the following to answer the questions
Q11: Use the following to answer the questions
Q12: Use the following to answer the questions
Q13: Use the following to answer the questions
Q14: Use the following to answer the questions