True/False
Use the following to answer the questions below:
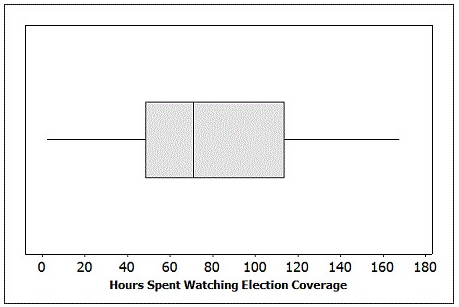
Many major television networks air coverage of the incoming election results during primetime hours. The provided boxplot displays the amount of time (in minutes) spent watching election coverage for a random sample of 25 U.S. adults. In this sample, the average time spent watching election coverage was 80.44 minutes with standard deviation of 43.99 minutes.
-Is it reasonable to use the t-distribution to construct a confidence interval for the average amount of time spent watching election coverage by U.S. adults?
Correct Answer:

Verified
Correct Answer:
Verified
Q87: Use the following to answer the questions
Q88: Use the following to answer the questions
Q89: Use the following to answer the questions
Q90: Use the following to answer the questions
Q91: Use the following to answer the questions
Q93: Use the following to answer the questions
Q94: <img src="https://d2lvgg3v3hfg70.cloudfront.net/TBW1049/.jpg" alt=" -What is the
Q95: Use the following to answer the questions
Q96: Use the following to answer the questions
Q97: Use the following to answer questions 18-21:<br>In