Multiple Choice
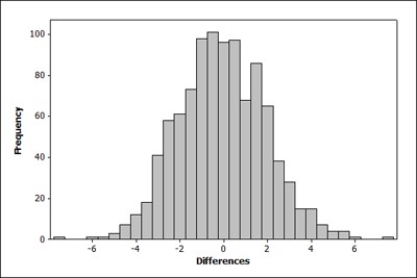
The following figure shows a randomization distribution for the hypotheses  versus
  The statistic used for each sample is
  Which of the two possible sample results provides the most evidence against
  ?
?
A)  = 56.5;
  = 51.3
B)  = 50.2;
  = 53.1
Correct Answer:

Verified
Correct Answer:
Verified
Related Questions
Q35: Use the following to answer the questions
Q36: Use the following to answer the questions
Q37: Use the following to answer the questions
Q38: Use the following to answer the questions
Q39: Use the following to answer the questions
Q41: Use the following to answer the questions
Q42: The null and alternative hypotheses for
Q43: Use the following to answer the questions
Q44: Use the following to answer the questions
Q45: Use the following to answer the questions