Multiple Choice
Use the following to answer the questions below:
According to ESPN.com, the average number of yards per game for all NFL running backs with at least 50 attempts in the 2011 season was 49 yards/game. A sample of 20 running backs from the 2011 season averaged 46.54 yards/game.
-Two boxplots are shown. One boxplot corresponds to the yards/game for a random sample of 
running backs. The other boxplot represents the values in a sampling distribution of 1,000 means of yards/game for samples of size n = 20.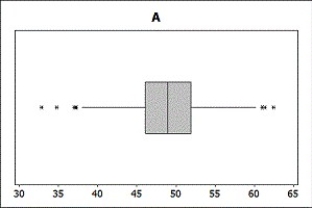
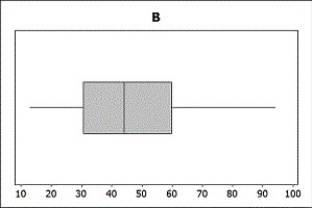
Which boxplot represents the sample? Which boxplot represents the sampling distribution?
A) Boxplot A is the sampling distribution while Boxplot B is a single sample.
B) Boxplot B is the sampling distribution while Boxplot A is a single sample.
Correct Answer:

Verified
Correct Answer:
Verified
Q138: Use the following to answer the questions
Q139: Use the following to answer the
Q140: Use the following to answer the questions
Q141: Use the following to answer the questions
Q142: Use the following to answer the questions
Q144: Use the following to answer the questions
Q145: Use the following to answer the questions
Q146: Use the following to answer the questions
Q147: Use the following to answer the questions
Q148: Use the following to answer the questions