Multiple Choice
The following figure illustrates the Keynesian model of equilibrium in the macroeconomy.
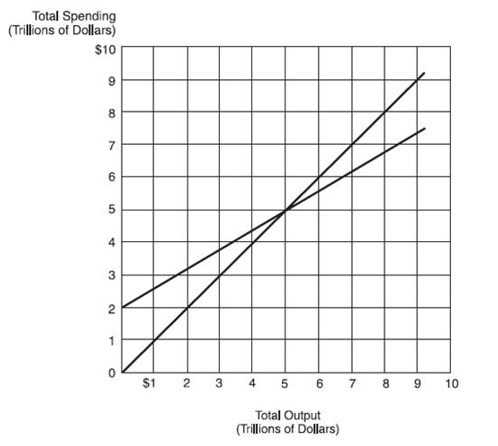
-Equilibrium will occur in this economy at an output level of:
A) $0.
B) $2 trillion.
C) $5 trillion.
D) $0 and $5 trillion.
Correct Answer:

Verified
Correct Answer:
Verified
Q36: Supply-side economics was popular during the presidential
Q37: The primary conclusion of the classical school
Q38: The expressions "open economy"and "closed economy"refer to
Q39: According to the natural rate hypothesis:<br>A) the
Q40: According to new classical economics, the wealth
Q42: Using the Keynesian approach, if leakages from
Q43: Which of the following schools of thought
Q44: The economic theory, popular before the Great
Q45: The basis of the following figure based
Q46: In Keynesian economics, the key to understanding