Multiple Choice
Plot the ordered pairs associated with the given data. (Let the first row be and the second row be .)
-Suppose that the speed of a car, measured in miles per hour (mph) , is monitored for some short period of time after the driver applies the brakes. The following table relates the speed of the car to the amount of time, measured in seconds (sec) , elapsed from the moment that the brakes are applied.
A) 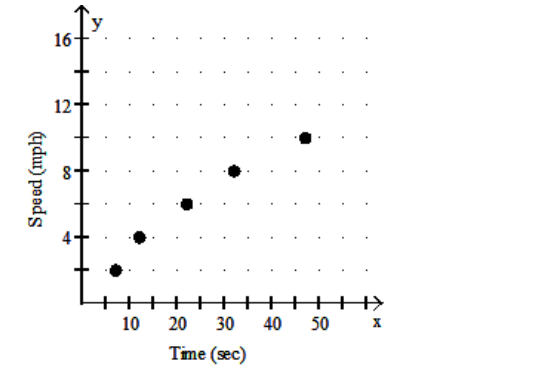
B) 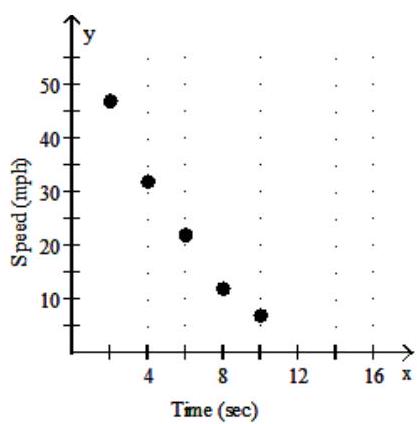 C)
C) 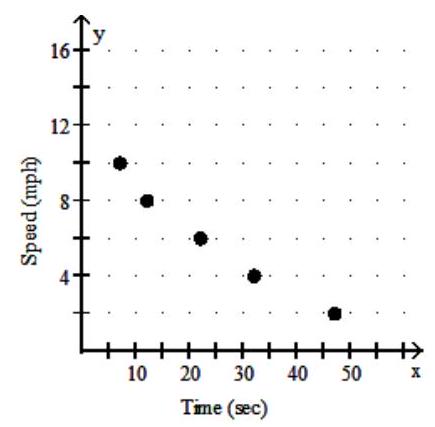 D)
D) 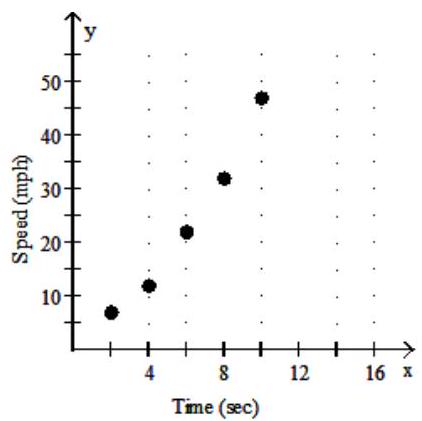
Correct Answer:

Verified
Correct Answer:
Verified
Q338: Jeremy was ordered to perform 350
Q339: The cost, in dollars, of retaining
Q340: For the given set of ondered
Q341: Find the <span class="ql-formula" data-value="x"><span
Q342: Determine whether a function exists with
Q344: Find three ordered pairs that are
Q345: Find the intercepts of the absolute
Q346: <img src="https://d2lvgg3v3hfg70.cloudfront.net/TB10229/.jpg" alt="
Q347: Graph the linear function.<br>- <span class="ql-formula"
Q348: A motorcycle daredevil is planning a