Multiple Choice
The following figure shows scatter plots with values , and -0.9 . Which scatter plot has value 0.5 ?
A) 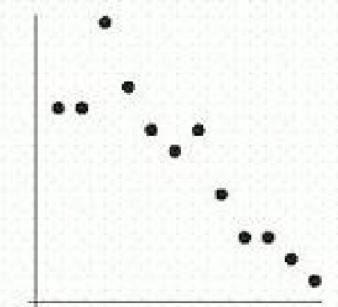
B) 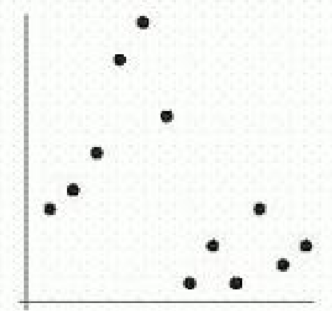
C) 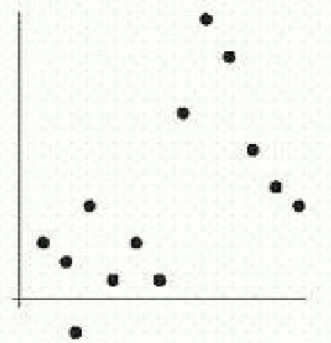
D) 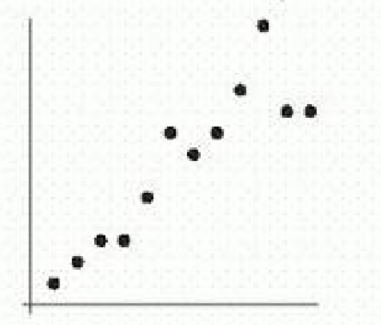
E) 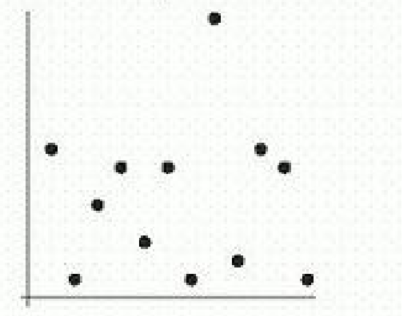
Correct Answer:

Verified
Correct Answer:
Verified
Related Questions
Q24: Let <span class="ql-formula" data-value="f(x)=x^{2}"><span class="katex"><span
Q25: An athlete wanting to strengthen his
Q26: The distance traveled by a car
Q27: Find the vertical intercept of the
Q28: Several years ago, the wild rabbits
Q30: Calculate the average rate of change
Q31: An airplane has room for 390
Q32: An athlete wanting to strengthen his
Q33: Use the following table to find
Q34: Determine the intersection of the linear functions<br>