Multiple Choice
The data points for the following table are graphed in the figure below.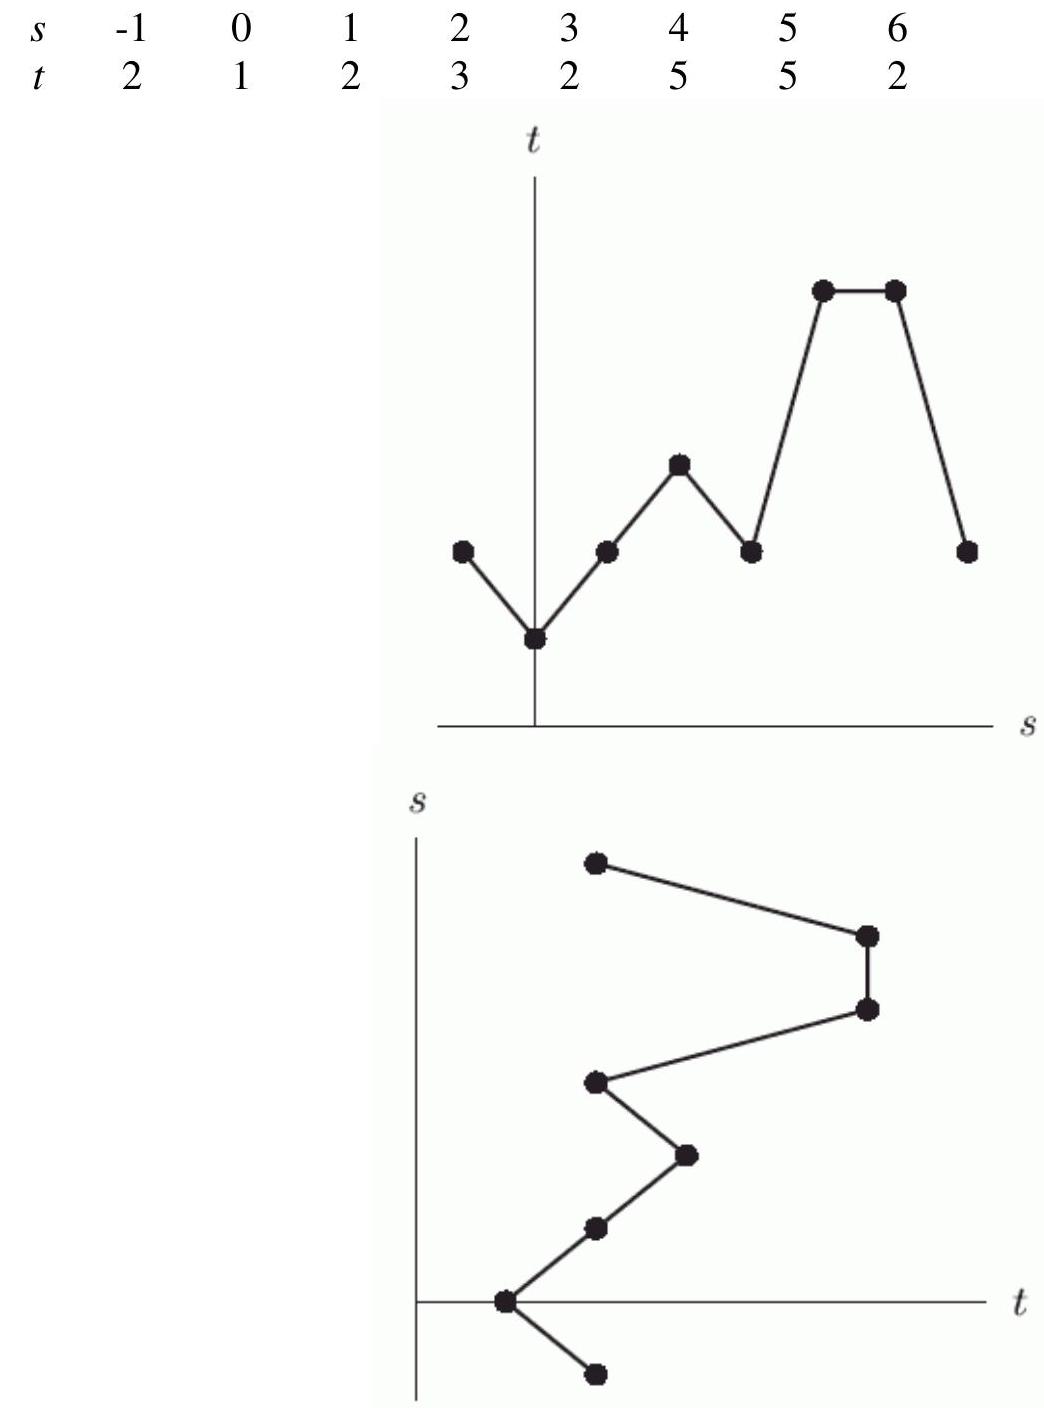
For the graph that is a function, what is its domain?
A)
B)
Correct Answer:

Verified
Correct Answer:
Verified
Q12: Let <span class="ql-formula" data-value="f"><span class="katex"><span
Q13: Find the inverse for the function
Q14: Let <span class="ql-formula" data-value="f(x)=\frac{4}{\sqrt{x+36}}"><span class="katex"><span
Q15: For a given function <span
Q16: A bowling alley charges <span
Q18: Given <span class="ql-formula" data-value="g(x)=4 x^{2}-5
Q19: If <span class="ql-formula" data-value="r(t)=e^{t}"><span class="katex"><span
Q20: A T-shirt printing company charges a
Q21: Graph the function:<br><img src="https://d2lvgg3v3hfg70.cloudfront.net/TBW1046/.jpg" alt="Graph the function:
Q22: The graph of <span class="ql-formula"