Solved
Calculate Successive Rates of Change for the Function Shown in the Following Table to Determine If the Graph
Multiple Choice
Calculate successive rates of change for the function shown in the following table to determine if the graph is more likely concave up or concave down for .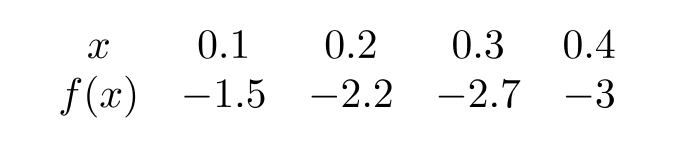
A) concave down
B) concave up
C) neither
Correct Answer:

Verified
Correct Answer:
Verified
Related Questions
Q3: A supermarket only sells cans of
Q4: A model rocket is launched from
Q5: Which of the following is a
Q6: Which of the following are not
Q7: Assume that height is a function
Q9: Find the inverse for the function
Q10: Let <span class="ql-formula" data-value="f(x)=\ln x"><span
Q11: Let <span class="ql-formula" data-value="g(x)=\sqrt{16-x^{2}}"><span class="katex"><span
Q12: Let <span class="ql-formula" data-value="f"><span class="katex"><span
Q13: Find the inverse for the function