Multiple Choice
Each of the functions in the table below is increasing, but each increases in a different way. One is linear, one is exponential, and one is neither.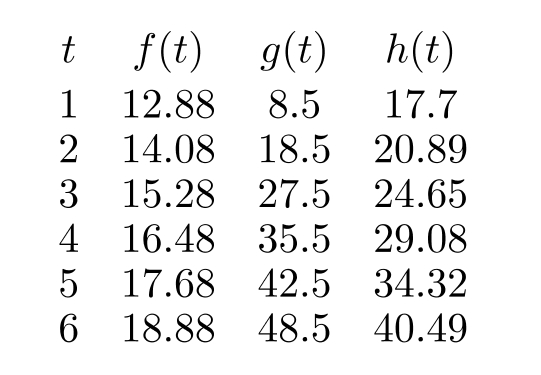
The following three graphs correspond with the functions in the table. Which is the graph of ?
A) 
B) 
C) 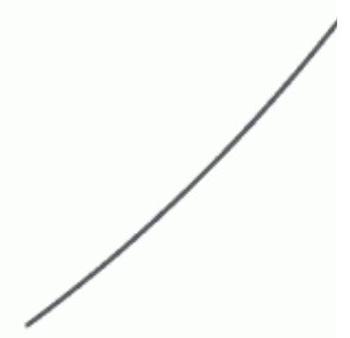
Correct Answer:

Verified
Correct Answer:
Verified
Related Questions
Q38: Write the formula for the price
Q39: A biologist measures the amount of
Q40: The graph of <span class="ql-formula"
Q41: An investment grows according to the
Q42: Which of the following characteristics describe
Q44: A population has size 3,000 at
Q45: If you start with <span
Q46: For the instantaneous compound interest in
Q47: Which of the following is correctly
Q48: The amount of pollution in a