The Graph of the Exponential Function Is Shown Below Represents a City's Population, in Thousands
Multiple Choice
The graph of the exponential function is shown below. Suppose represents a city's population, in thousands, years after 1995. Which of the following quantities are equivalent?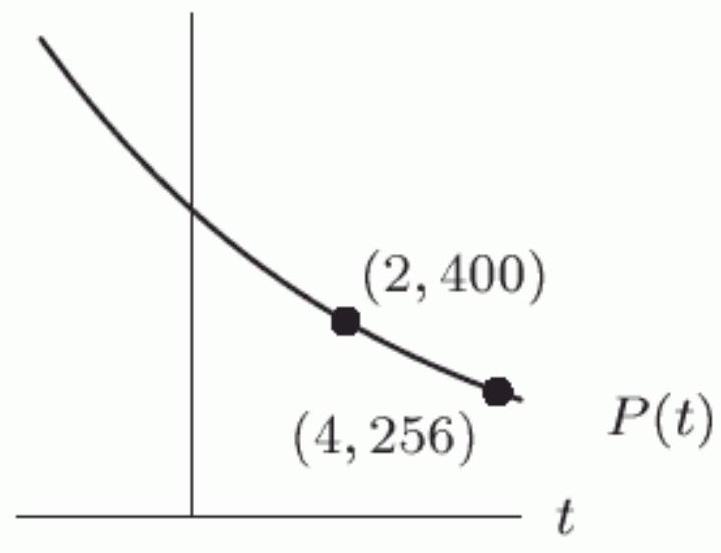
A)
B) Approximately -125 thousand
C) Approximately 387 thousand
D) The change in the city's population between 1999 and 2002
E)
F) The rate at which the population is declining between 1999 and 2002
Correct Answer:

Verified
Correct Answer:
Verified
Q81: Suppose the amount of ozone in
Q82: A quantity decreased from 100 to 95
Q83: The following figure shows two functions,
Q84: You invest <span class="ql-formula" data-value="\$
Q85: Find <span class="ql-formula" data-value="\lim _{x
Q87: In the exponential formula <span
Q88: In some developing countries, the inflation
Q89: Let <span class="ql-formula" data-value="f(x)"><span class="katex"><span
Q90: The US population in 2005 was
Q91: What is the horizontal asymptote of