Solved
The Following Figure Gives the Graph Of , Where Is the Computer Hard Disk Capacity (In Hundreds of Megabytes)
Short Answer
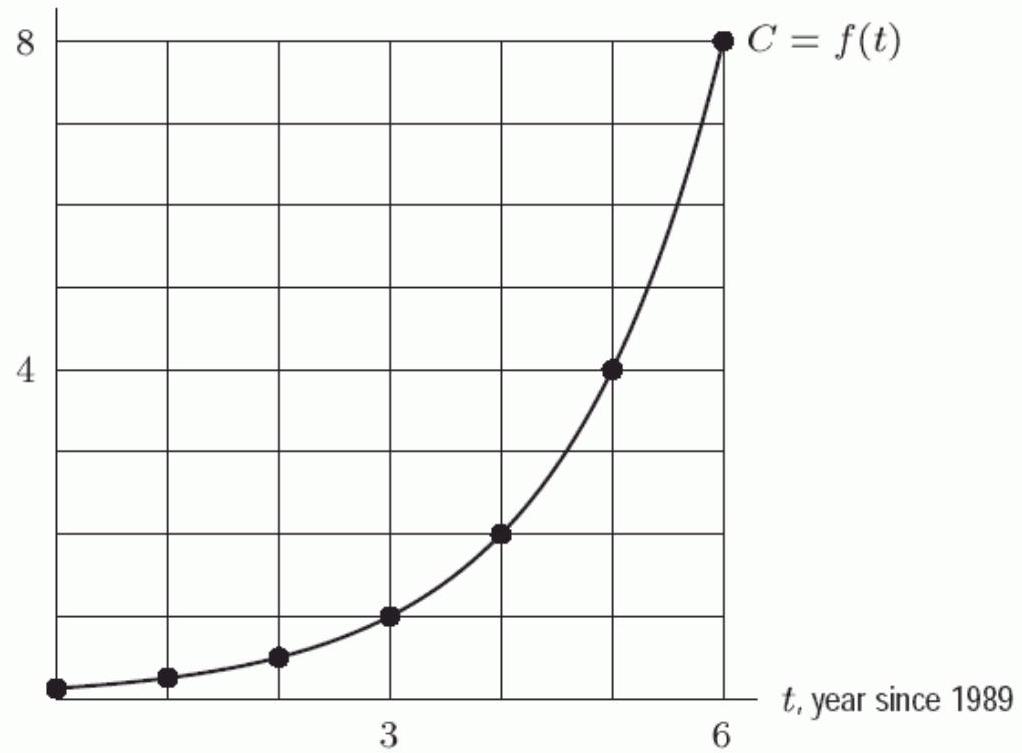
The following figure gives the graph of , where is the computer hard disk capacity (in hundreds of megabytes) that could be bought for years past 1989 . If the trend displayed in the graph continued, how many megabytes would a hard drive have in 1997? Round to the nearest hundred.
, capacity (in 100 s of megabytes)
Correct Answer:

Verified
Correct Answer:
Verified
Related Questions
Q45: If you start with <span
Q46: For the instantaneous compound interest in
Q47: Which of the following is correctly
Q48: The amount of pollution in a
Q49: Match the graph to its equation.<br><img
Q51: The population of a city has
Q52: The population of a city is
Q53: A store's sales of cassette tapes
Q54: For the instantaneous compound interest in
Q55: What is the maximum number of