Short Answer
The following figure shows the graphs of
(A).
(B).
(C).
(D). .
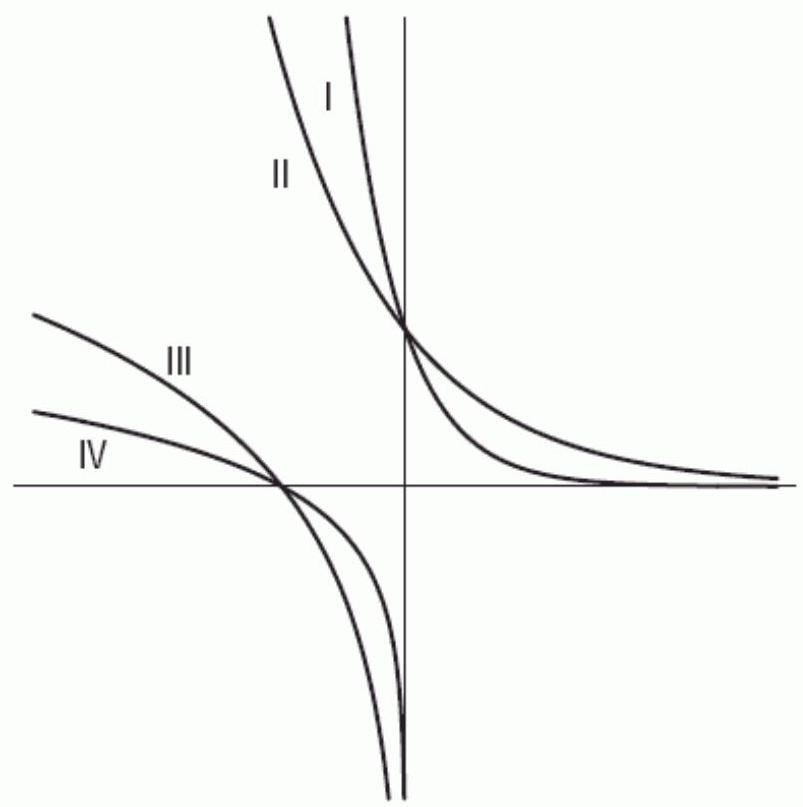
Which one is the graph of A?
Correct Answer:

Verified
Correct Answer:
Verified
Related Questions
Q59: Suppose earthquake A measured 3.6 on the
Q60: The following table gives <span
Q61: The half-life of a substance is
Q62: The following table gives <span
Q63: Find the domain of the function
Q65: The following table gives <span
Q66: The notation <span class="ql-formula" data-value="\log
Q67: An earthquake measured 5.1 on the Richter
Q68: Use linear regression on the values
Q69: Suppose the population of an endangered species