Multiple Choice
One of these graphs shows a transformation of an exponential function, and one is a transformation of a log function. The remaining graph is not a transformation of either an exponential or log function. Which graph is the transformation of a log function?
A) 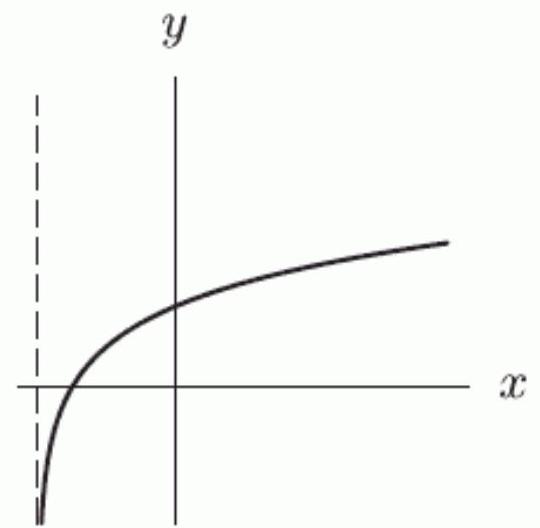
B) 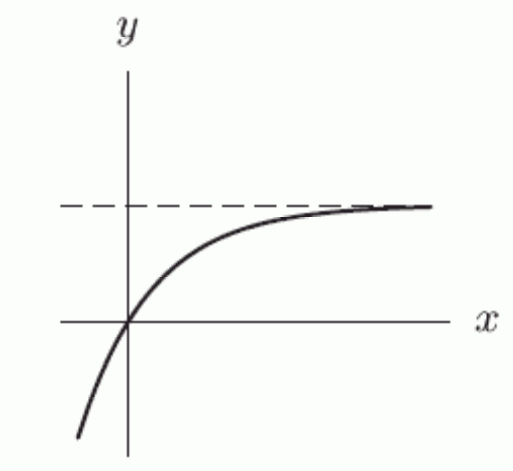
Correct Answer:

Verified
Correct Answer:
Verified
Related Questions
Q55: The following figure shows the graph
Q56: The amount of money in your
Q57: If <span class="ql-formula" data-value="f(x)"><span class="katex"><span
Q58: Suppose the range of <span
Q59: The average rate of change of
Q61: The graph of a function
Q62: Some of the values of
Q63: The following table gives values for
Q64: Which of the following functions are
Q65: Let <span class="ql-formula" data-value="f(x)=-3 x^{2}+3"><span